The press surrounding Happy’s FDA Clearance for cuffless blood pressure (BP) on the Happy Ring explains why cuffless BP in a wearable form-factor is revolutionary for preventative medicine and can literally help save millions of lives. That is certainly the headline and motivation for creating it in the first place. At the same time, there is another story that is equally-interesting to the technical community: how exactly did you solve cuffless BP?
The combined capital spent chasing cuffless BP in a wearable device is comfortably in the billions. Startups have been chasing this elusive holy grail for more than 20 years1.
"Wearable health monitoring is a multibillion-dollar industry. But the holy grail is probably getting it right for blood pressure monitoring without a cuff, because raised blood pressure is very common and the leading cause of death in the world."2
The industry has recognized this specific challenge for years; in fact the IEEE already worked to draft an objective performance evaluation for "wearable cuffless blood pressure measuring devices" more than a decade ago. So why did it take so long to create?

As the Principal Data Scientist at Happy Health, this latest SAMD FDA Approval follows several others (Pulse Rate, SpO2, and Apnea/Hypopnea Index) for which I was the primary3 developer.
For each of these algorithms, translating complex physiological signals into patented, FDA-cleared health technology required a departure from black-box machine learning. First-attempt regulatory clearance for each of these algorithms was possible because the approaches were grounded in biophysics and signal processing rather than black-box machine learning models.
But BP was, by far, the hardest and most-complicated algorithm I have ever built. In this post, I’m going to pull back the curtain on what it takes to build a cuffless BP algorithm. Our journey will attempt to provide insight on:
- Why is this such a hard problem?
- Why did it take so long to achieve cuffless BP in a wearable?
- What are the conceptual building blocks that make it possible?
- What were the most interesting lessons learned in the process?
My biggest goal in sharing this journey with you is that perhaps it will inspire you to keep working on your impossible goals. Sometimes, hard problems are just really hard. And it takes tenacity and devotion to achieve them. If someone had told me six years ago that I would make a cuffless, absolute BP algorithm work for a smart ring on a microamp power budget, I would have laughed out loud. Because it would have seemed more than a little outrageous. But, it turns out, even hard problems can be solved one step at a time.
Why is Cuffless Absolute Blood Pressure so Hard?
“Blood Pressure” usually refers to the arterial blood pressure, frequently measured in the radial artery. A flexible tube is inserted into the artery and connected to a transducer that can measure the pressure of the blood within the artery. I’m not sure if you have ever had an arterial line put, but even with a local anesthetic, it hurts like hell. The arteries are intentionally protected deep within the tissue, so the needle has to go pretty deep as well.
Blood pressure cuffs work by compressing the artery in the arm until the blood flow completely stops; then the pressure is slowly released.
- Systolic (SBP) is measured as soon as the blood is able to flow again.
- Diastolic (DBP) is the pressure measured when the cuff is no longer impeding blood flow at all.
- Mean Arterial Pressure (MAP) is the average pressure and sits somewhere between SBP and DBP.
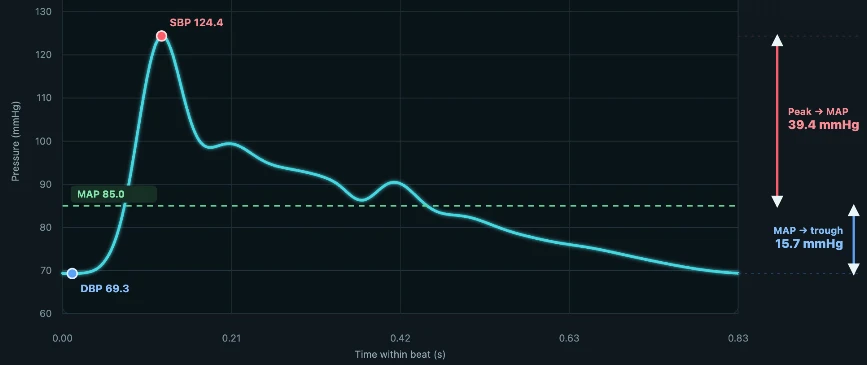
A cuffless BP device needs to reliably measure other signals in the body that correlate with the arterial pressure, but without being invasive. And, if they are also comfortable to wear (especially during sleep), then a massive world of opportunities opens up for preventative medicine4.
So, the game becomes one of finding alternative sensors to query the tissue bed. Photoplethysmography (PPG) uses LEDs to shine light into the skin and then measure how much of it reflects back (or transmits through). While not the whole story/solution, looking at PPG allows us to get a bit of a flavor for why the problem is hard, and the sorts of approaches that actually work.
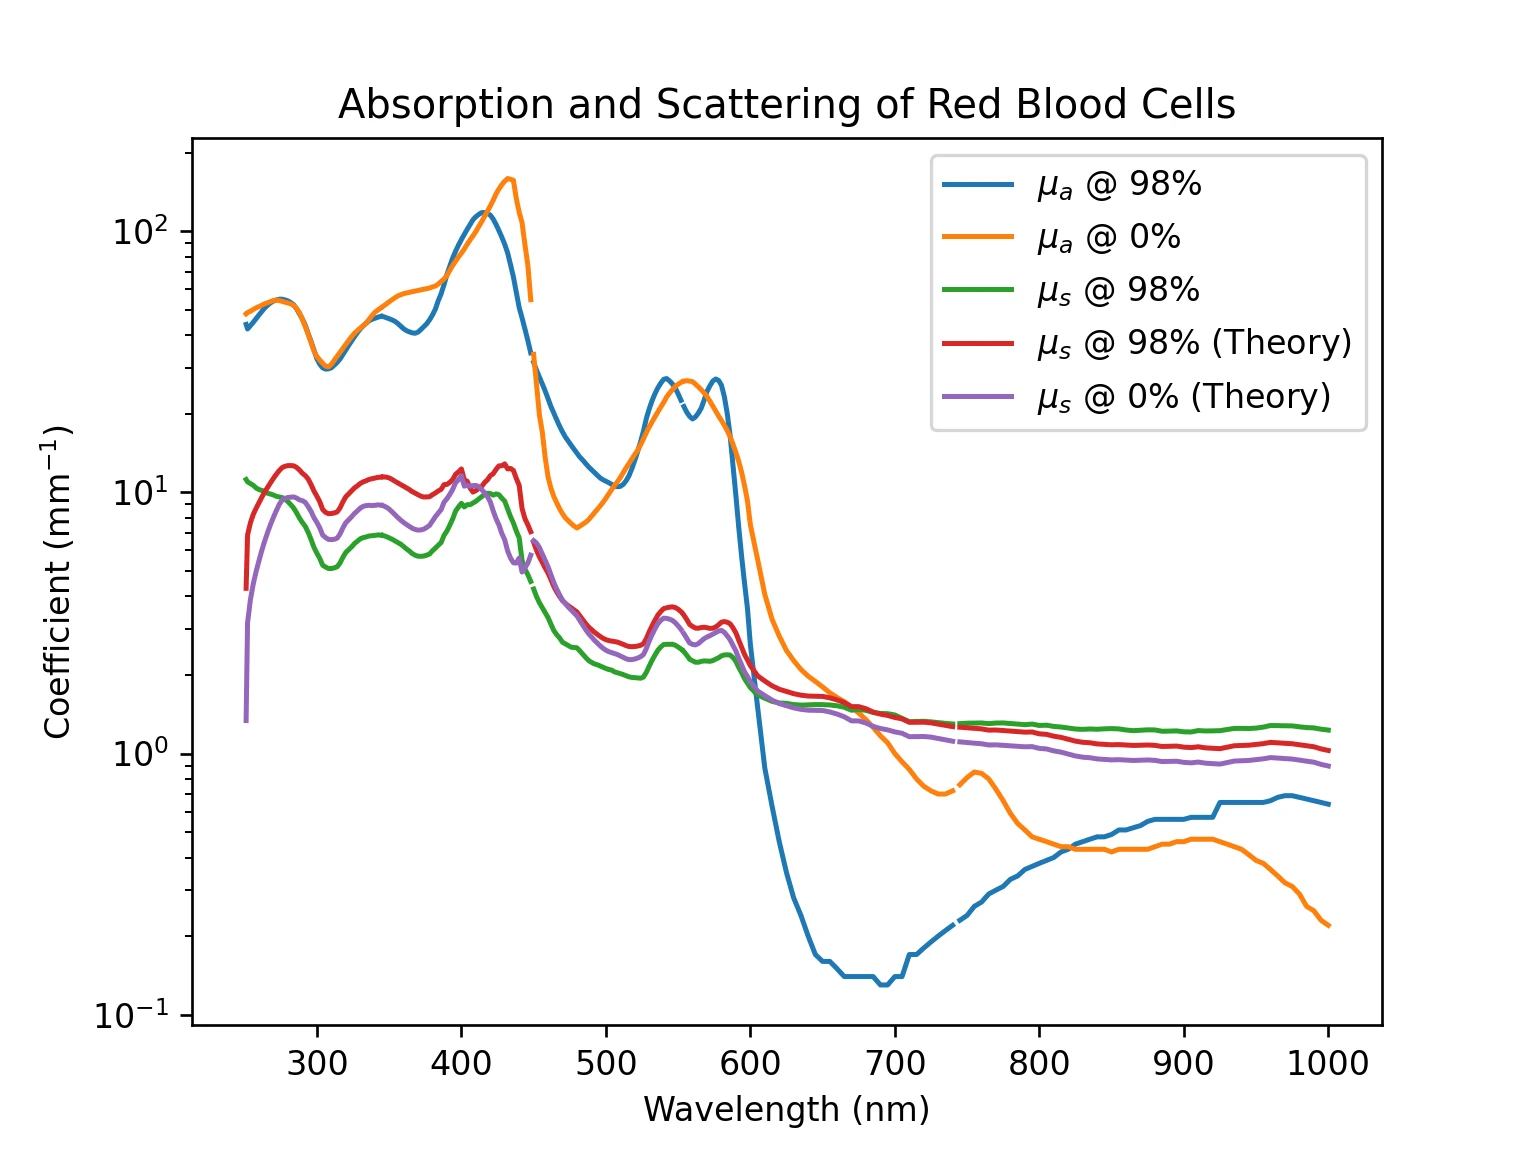
In Figure 2, I plotted the “absorption” and “scattering” coefficients of red blood cells. Due to the physics of light, different wavelengths of light interact differently with objects depending on their size and what they are made of. This plot demonstrates the first, super important ingredient: absorption/scattering in blood changes depending on how much oxygen is in the blood. Since this is already a very hard problem, if we pick a wavelength for our LED when the absorption changes depending on how the person is breathing, we are going to make our lives very hard. There are special points on the curve where the absorption/scattering does not depend on blood oxygen at all. These are called “isobestic” points. If our hardware is carefully selected so that our LEDs operate at these wavelengths, then we won’t have to deal with our absorption/scattering coefficients changing as a person breathes. David Clift-Reaves (our CTO) designed the hardware on the ring specifically so that we would have a chance at cuffless BP six years ago! He wrote a similar post about the extraordinary planning that went into designing and building the hardware to be “future-proof”. It is a fascinating story with many insights.
It’s probably obvious by now that the name of the game with optics is going to be related to absorption/scattering. That’s right! Since the number of photons leaving my LED is (relatively) constant, if there is more blood (greater volume) in the tissue, then there will be more absorption/scattering. This is how PPG-based heart rate detection works: with each heart beat, the tissue gets a “spurt” of blood that then circulates back out. These create the little PPG “wiggles” seen on the right-hand side in Figure 3. The wiggles are caused by changing blood volume in the tissue, which in-turn, affects how much of the light is being scattered/absorbed.
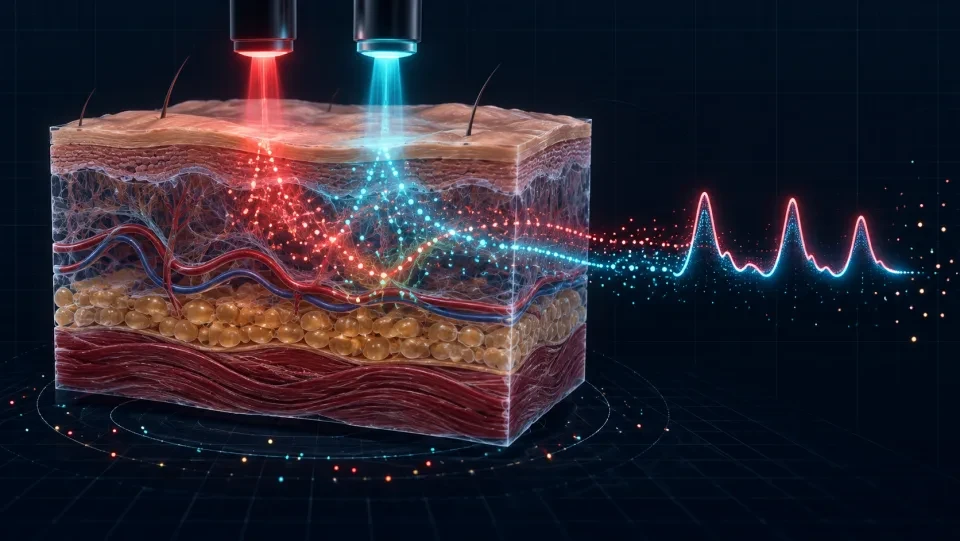
This is the first important finding: the PPG wiggles are proportional to the blood volume change in the tissue. However, blood is not the only thing in the tissue bed that absorbs and scatters light. As you can see in Figure 3, the tissue bed is highly complex. At a minimum, the differences due to melanin content, water concentration, and “everything else” need to be addressed one-by-one. By subtracting out the changes due to melanin/water/tissue from the measured reflectance, what we have leftover is approximately the volume change in the blood itself. This step means we collect experimental diagrams like the one in Figure 1, and then use ~15 equations from optics (Mie and Rayleigh Scattering as well as absorption in the various layers of the dermis) to determine the differential volume of blood in the tissue at different depths. Temperature also changes the wavelength of the LEDs used to measure PPG in the first place. So even if your LEDs are selected to be at the isobestic frequencies, you need to be extra careful to compensate for temperature shifting of wavelength, and how it impacts the absorption/scattering curves.
The key insight here is “different depths”. By using four different wavelengths of light in the Happy Ring, we are able to access volume changes at four different depths. As the digital artery branches into arterioles, which further branch into capillaries, the blood volume we can measure using the LEDs changes at each of those depths. But, how do you know how deeply a particular wavelength of light penetrates? Via simulations that leverage Mie/Rayleigh scattering equations at each layer of the dermis.
All the complexity so far served a single purpose: to obtain a differential volume at various tissue depths. Part of the reason cuffless BP is so hard is that there is a giant chasm between “relative” BP (how much BP changes once a baseline is known) and “absolute” BP (finding the baseline/anchor). If all you have from optical sensors is a differential volume, it is basically impossible to extract an absolute measurement. In practice, the y-axis of the differential volume curve is in “arbitrary units” because each person has a unique tissue bed structure and baseline volume in their tissue. So although the relative changes in BP have the correct shape encoded in the differential volume estimates, how to scale that shape in units of mmHg is already a hard problem. And the actual absolute baseline/anchor BP is still unknown.
Said differently, pressure is directly proportional to the rate of change of volume. The coefficient that determines the mapping from volume to pressure is called the vascular compliance coefficient. And it depends on a lot of physiological processes:
- Hematocrit level
- Hydration
- Temperature
- The baroreceptor reflex, where the sympathetic nervous system modifies the vascular resistance to help regulate BP.
- Anxiety (or general cognitive stress)
- Reduced O2 and/or increased CO2 in the blood can induce vasoconstriction.
- Physical strain/stress, which will be induced during BP shifts
- Blood pressure medications
This list makes it clear that humans are really complex. And that there are so many confounding factors that can affect how the veins/arteries expand/contract to compensate for environmental changes and even mental/emotional state (for example, the fight/flight response). This also makes it ultra-clear that it is probably impossible to solve the problem using optics alone; even with all the fancy biophysics and optics done right from first principles.
Getting the Hardware Right
Apart from the clear need for multi-depth, isobestic PPG, the lack of an absolute anchor is where bioimpedance enters as the star-performer. Bioimpedance measures the impedance (similar to electrical resistance) between two or more electrodes. If you place the electrodes on the surface of the skin, then the path that the current flows through will be the tissue bed. And, depending on how far apart the electrodes are, you can probe different depths in the tissue bed. Some researchers have already shown5 that bioimpedance alone can measure blood pressure. However, both the hardware and the deep learning algorithms used in those studies are a significant barrier: 1) we want to be able to measure BP overnight during sleep since that is most clinically relevant6, so the device must be comfortable; 2) the FDA does not like deep learning in general. Black boxes that happen to produce the right answer are exponentially harder to get approval for. The required cohorts and number of studies are much higher precisely because the answer being provided doesn’t have a rigorous, mechanistic explanation like the discussion we’re having here. One of the primary reasons we were able to obtain the FDA Approval for BP is that the methodology we used is based in signal processing using biophysics and optics. We know why the numbers we are producing work. And we can explain it down to the tissue level using physics.
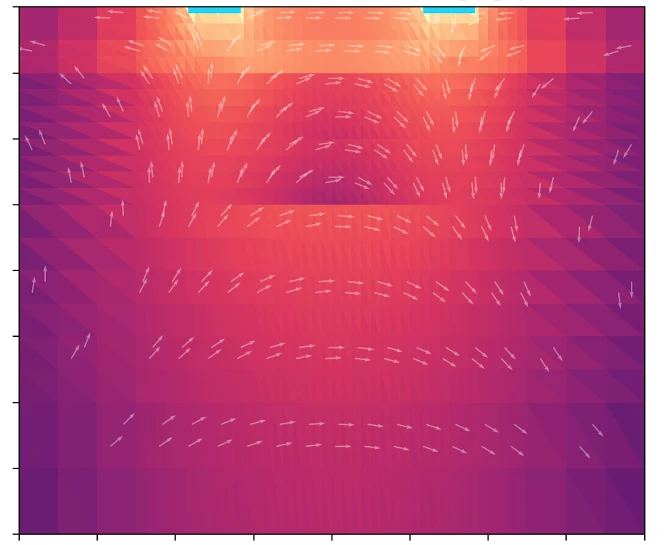
Bioimpedance (BIS) gives us additional insight into the volume at various tissue depths. And, importantly, can be calibrated using the differential volume measurements from the optical sensors. To get bioimpedance right requires clever architecture of the hardware and electrode pads (once again, see David’s hardware post). Because contact resistance is different for each person, we use 4 electrodes instead of 2. That allows us to “subtract out” the majority of the contact resistance using some clever math. Then, we can use the Finite Element Method (FEM, see Figure 4) to simulate the volume and compliance at various tissue depths. Critically, the FEM has many free parameters that require 1) rigorous “bench” calibration; 2) in-field calibration each time the ring boots; 3) optical calibration at various tissue depths. Without all of these ingredients, the FEM ends up collapsing the distribution of predicted BPs to the normal distribution. Basically, you predict 120/80 for everyone and your errors don’t look too bad. However, to prevent the tails from being compressed toward the mean (at very high or very low blood pressures), proper FEM for the BIS is absolutely critical!
Compliance: From Volume to Pressure
So, let’s assume that we do the optics correctly and obtain differential volumes that make sense at the different tissue depths. We then use those to calibrate our BIS at various tissue depths. We know that pressure and volume are related via compliance, but how do we back-out the compliance model?
Medical school textbooks frequently portray BP in the tissue using a sigmoidal function. In the cardiovascular system, arteries use positive hydrostatic pressure provided by a pump (the heart). However, veins are “passively” drained using oncotic pressure. Because of this qualitative difference, the lower end of the pressure sigmoid is always around 7 mmHg for everyone. And the pressures at other depths follow the sigmoidal shape as we get closer to the digital artery where the pressure is highest. Although this curve shape is deceptively simple, things get a little bit more complicated at high and low pressures. So instead of just using it “out of the box”, we instead had to develop a custom dynamical differential equation to explicitly handle the extraordinary effects that happen at high/low pressures.
At normal pressures, the arteries and veins behave basically like pipes. At high pressure, however, they provide an active force restricting the flow and further expansion of the pipe. This is also why the “stiffness” of the arteries is frequently a topic of discussion for older folks7 and certain pathologies (like diabetes) where that stiffness makes the arteries behave differently. Thus, our compliance calculation needs to be sophisticated enough to deal with these details.
One important caveat (left as an exercise for the reader) is that in real life, the oncotic/drainage pressure at the venules is not always perfectly 7 mmHg. In fact, depending on the environment, hydration, temperature, SNS activation, baroreceptor reflex, etc. the vasoconstriction can cause pooling in the arterioles or venules. Which will necessarily affect the ODE/sigmoidal calculations. If there was a way to compute SpO2 as a function of tissue depth, and we could do that near the surface of the skin (where the venule density is higher) and deeper in the tissue (where the arteriole density is higher), then we could detect whether the tissue was in a hemodynamically-, and metabolically-stable condition. If the tissue is not in “homeostasis”, then we must not give an answer. The reason we choose to not give an answer is that all the confounding variables in the vasoconstriction are highly non-linear. And we don’t necessarily have accurate models for all of them. Although we can model hydration, and we have access to skin temperature, baroreceptor reflex and other SNS activation is extraordinarily difficult to measure. For example:
- Slow thermoregulatory vasomotion and neurohormonal effects on BP have lags of 30-120 seconds.
- Baroreflex/Mayer waves (due to SNS) have BP lags of ~10 seconds.
- Cardiodynamic (respiratory and heart-rate variability) effects have lags of 1-2 seconds.
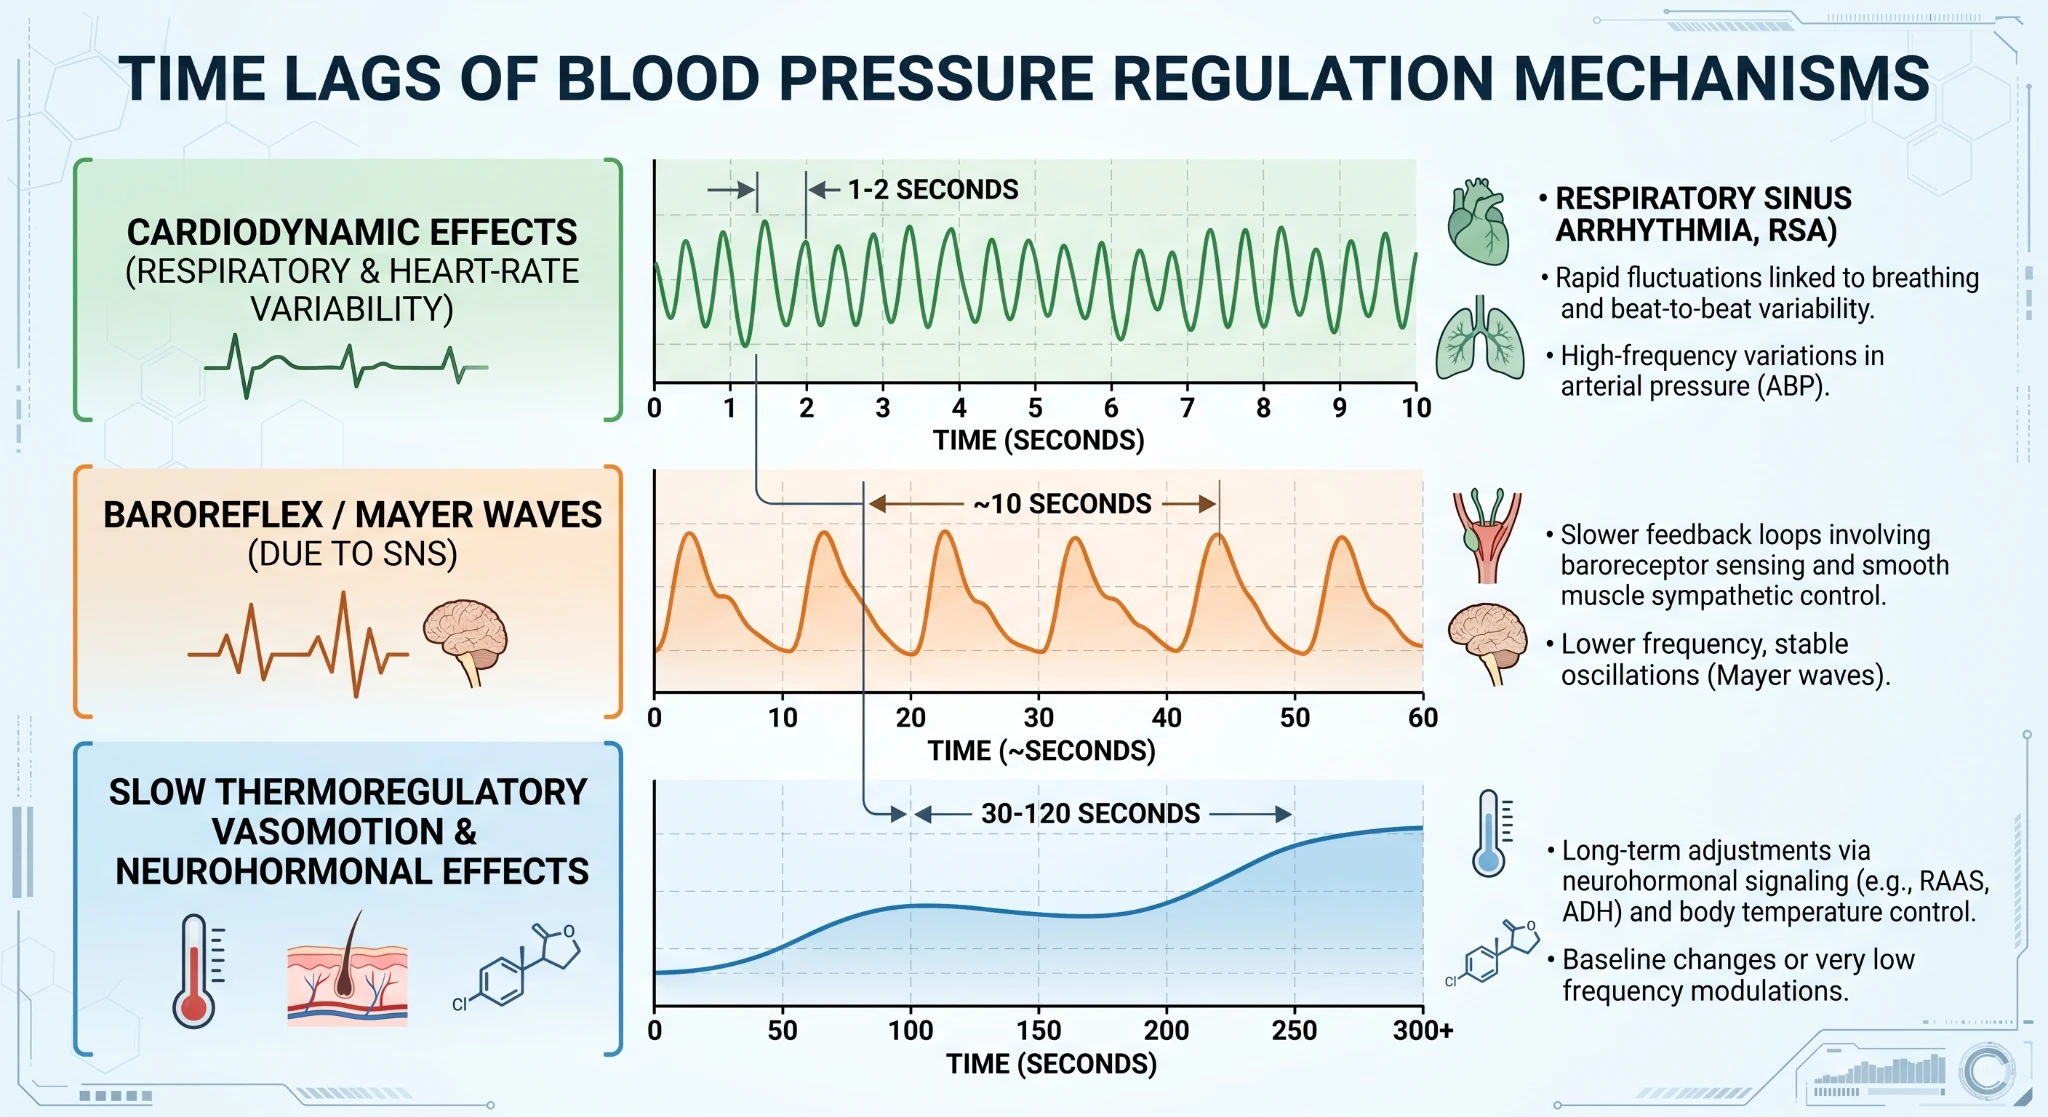
In complex human beings, trying to model these lags (and their non-linear combinations!) is extremely difficult using only the sensors on a ring. So we need to find a convenient corollary that can tell us “these confounding factors are minimal right now”. The venous/arteriole pooling is precisely that insight.
Lessons Learned
And that brings us to the end of our high-level journey. I hope that these points were all clear:
- It is important to understand the biophysics that your sensors are using. Treating sensor signals as generic signals outside of the context they were created in discards the most valuable information of all.
- Rather than reaching for blackbox tools like convolutional neural networks (CNNs) to automatically find the features in the signals, a principled approach directly in physics provides stable ground. The answers from the equations have units. And if you’re testing that physics at multiple tissue depths, you can apply some simple inequalities based on the rich clinical literature to help know you are right.
- It may be tempting after seeing the answer to nod along and “post-dict” that this all makes sense. Don’t forget that a short story like this came after 6+ years of hard work and iteration (just like Michael Faraday’s 10K+ experiments in electromagnetism can be taught in 2 hours in a classroom). Why is that relevant? No matter what you are pursuing, there will be setbacks and difficulties. If you hit a wall, “more data” and larger CNNs may not be the solution. Perhaps digging deeper into the physics behind the data will provide the insights you are missing.
- Each layer of complexity was added in because it was necessary. When you consider that even the first layer of differential absorption/scattering/volume needs 15+ physics equations and many experimental tables, you can see why deep networks may have a difficult time. Subtracting out the contributions of melanin/water/tissue bed from the spectra is each a non-linear operation that relies on a bunch of clinical research and published absorption spectra. Would we have even thought to give that information to a CNN if we weren’t already doing “physics”? Or adjusting the LED wavelengths based on temperature?
- There is no free lunch. We only arrived at the answer after appropriately addressing each of the variables impacting what we were measuring. “Hoping” that somehow the ML model will average away the complexity and magically find the signal in the raw sensor values is a pipe dream for something as complex as blood pressure.
And, finally, returning to my intention in writing this piece to begin with. There are still an unending number of exciting and impactful problems that remain unsolved. Sometimes, the “brilliance” needed to solve the problem is the passion and curiosity to keep peeling back the layers and never stop learning. This is especially true in the age of agentic-supported research: this algorithm was created and submitted to the FDA last year before agents were “good enough” to just hand things to. Of course, earlier this year I gave an agent (on maximum reasoning level) access to some of the fundamental code/equations and raw data and told it to solve the problem itself. After 14 hours, its “best” solution was a total failure. My point is not to bash LLMs/RL/etc., they are extremely helpful. Rather, more than ever before, we have the tools to accelerate discovery and impact by doing precisely what we’re good at: staying curious and asking the hard questions. Never give up!
Notes & references
For example, Aktiia (now Hilo), one of the leaders in the European market, spun out of a Swiss research center (CSEM) after 15 years of dedicated R&D before they even launched a commercial product. ↩
By “primary”, I mean that I wrote the code by myself, by hand. Of course there are many ideas and discussions with others during meetings/presentations/etc. And some shared functions in the library. Nobody truly does anything “single-handedly”, but these algorithms were about as single-handed as it gets. ↩
Ambulatory blood pressure (ABP) values recorded during nighttime sleep are considered superior to daytime clinic measurements for predicting cardiovascular disease (CVD) risk (Silvani, 2019). Furthermore, review literature specifically highlights that mean nocturnal blood pressure levels serve as the most sensitive predictor of cardiovascular morbidity and mortality, making overnight monitoring a critical component of preventative screening (Yano & Kario, 2012). ↩
As discussed previously, nocturnal blood pressure is the single most sensitive predictor of cardiovascular morbidity and mortality. ↩
For this FDA Approval, we explicitly excluded subjects over 50 years of age so that the problem was easier to solve. We plan to tackle the 50+ year old subjects soon. ↩